
From Demo Request to Closed-Won: The Sales Metrics Every Founder Needs to Track
PART 10 OF 12 | THE STARTUP MARKETING PLAYBOOK | BLOG POST
Most startup marketing dashboards are built around the top half of the funnel. Traffic, followers, email subscribers, and lead volume are visible, easy to measure, and satisfying to watch increase. But they're also only half the story.
The bottom of the funnel is where the most valuable information lives. It's where you find out whether the leads you're generating are actually the right people, whether the trust you've been building is actually translating into intent, and whether the sales process is converting that intent into revenue–because ultimately, that’s what matters the most.
Sure, bottom-of-funnel metrics are less glamorous than top-of-funnel metrics. But they're also far more actionable, because they tell you specifically what's breaking down and where, rather than just how many people entered the system.
The Six Metrics That Matter at the Bottom of the Funnel
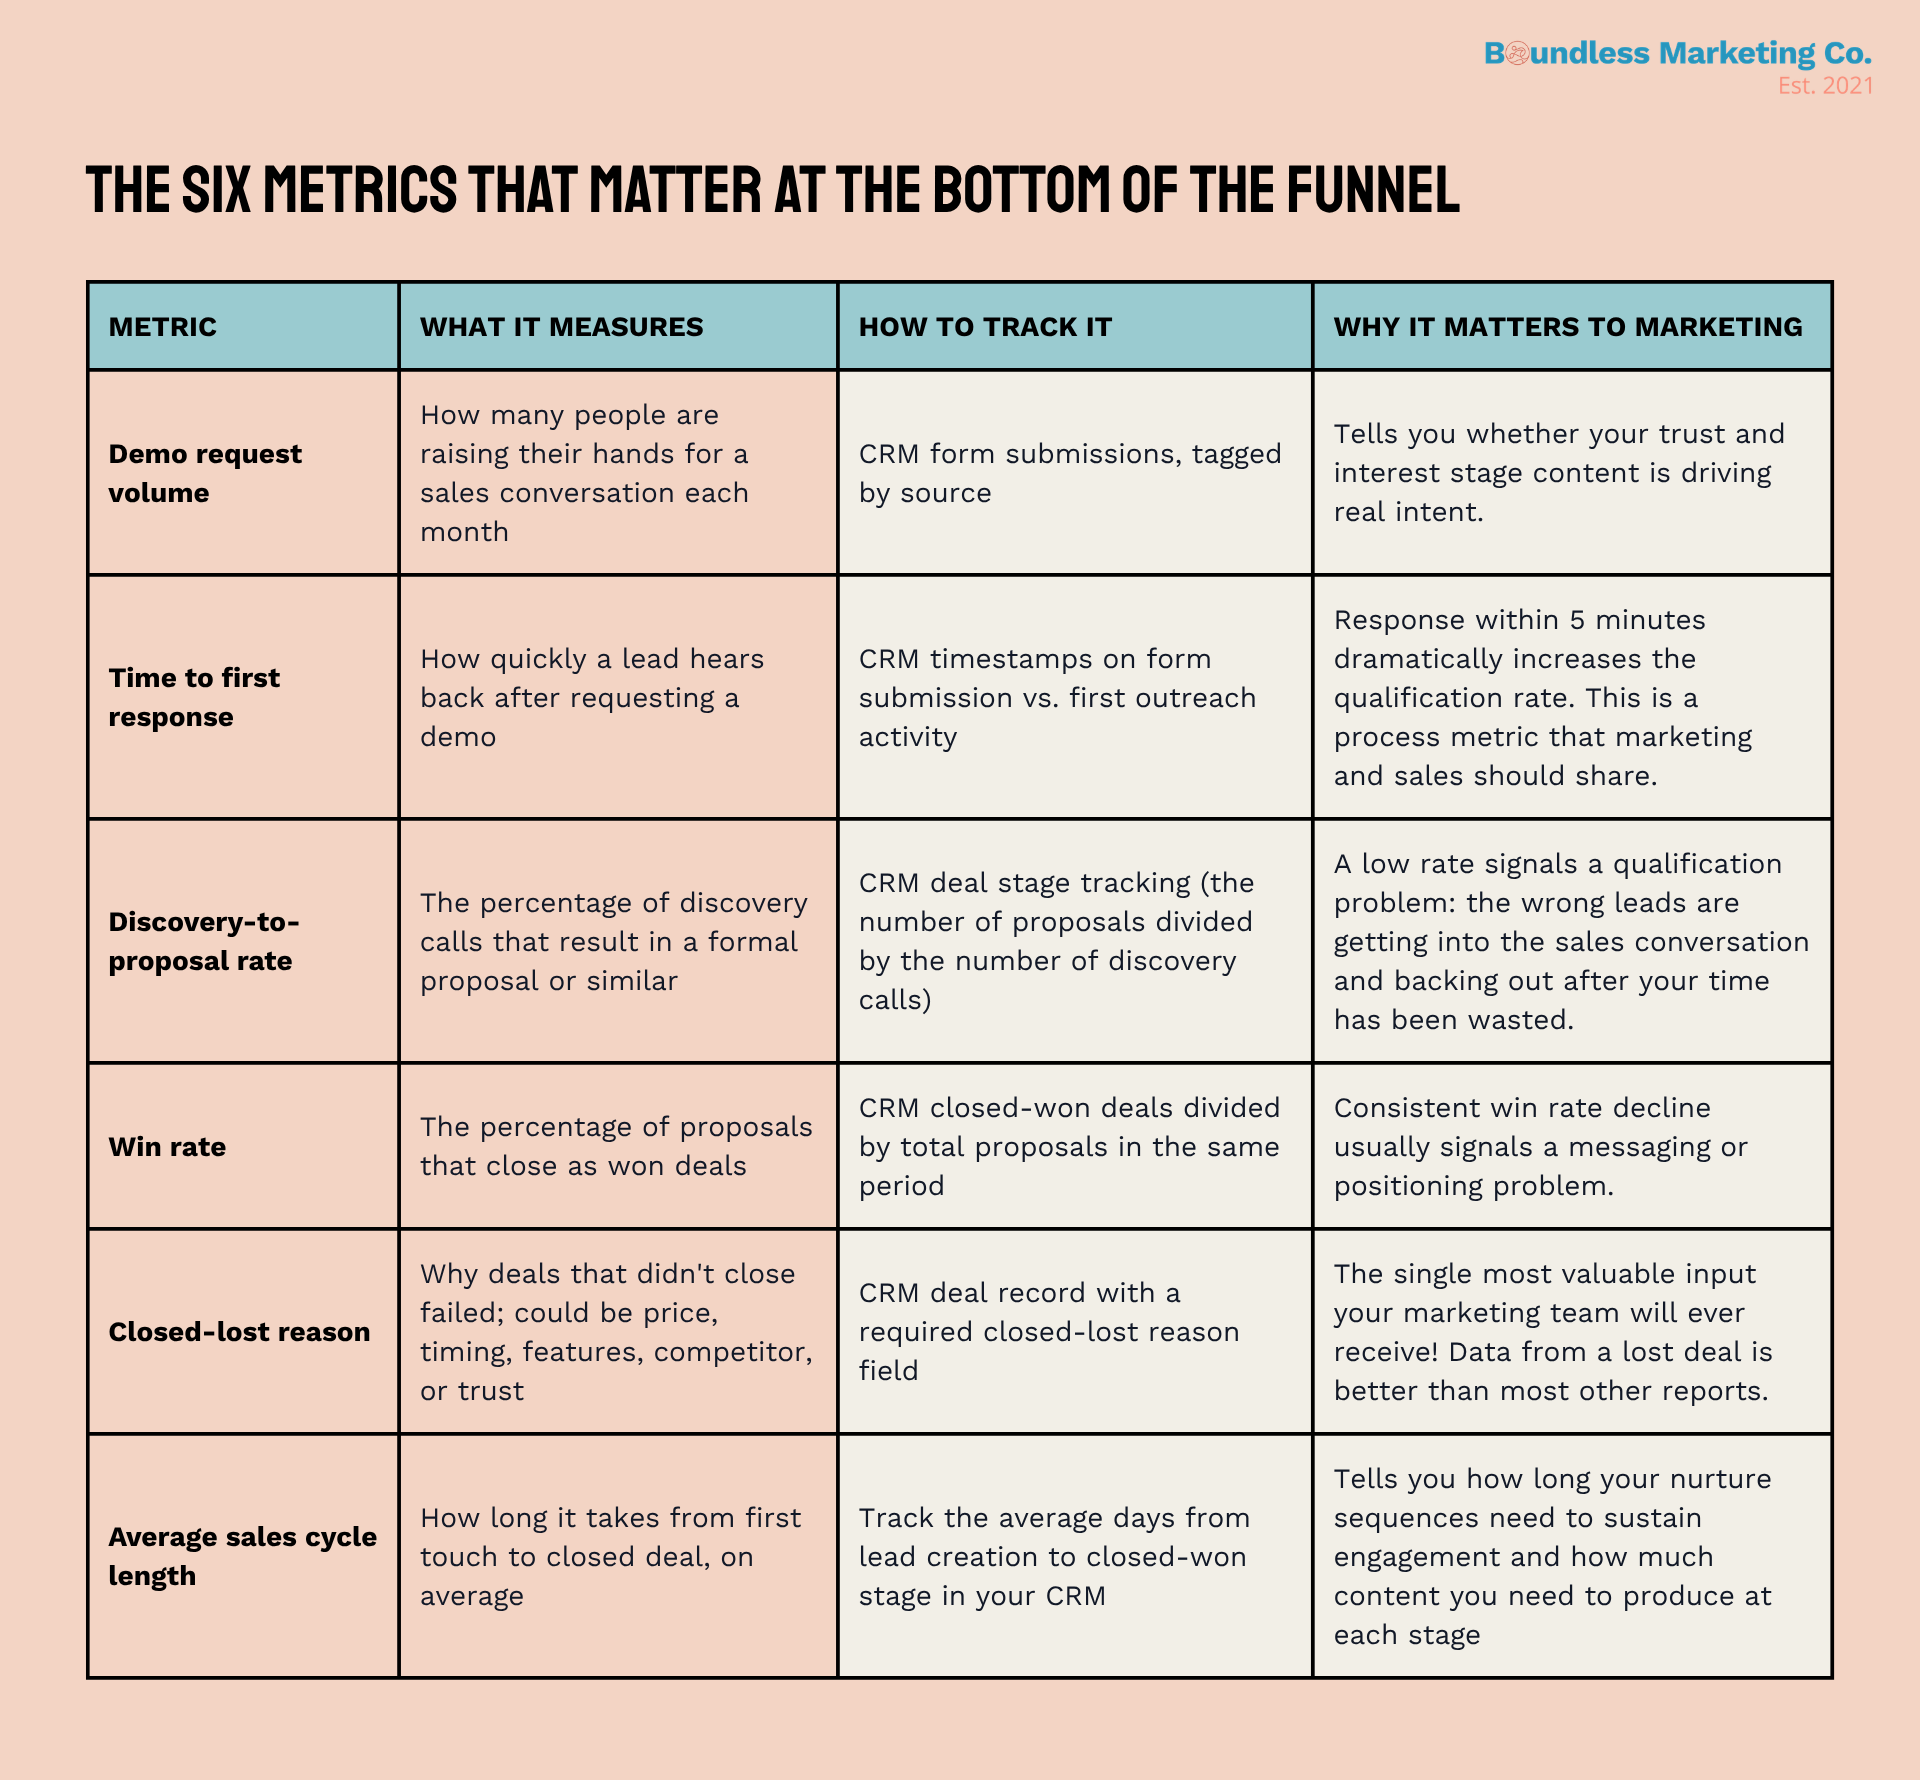
Demo Request Volume
Demo requests are the clearest bottom-of-funnel signal your marketing generates. Someone who fills out a demo request form is telling you they've already moved past awareness and trust and into active evaluation. They want to see if your product actually does what you say it does.
Track demo request volume by month and by source. Source attribution is critical: if most of your demo requests come from a single channel or a single piece of content, that tells you where to invest more. If you can't attribute your demo requests to a source, you're flying blind on which marketing activities are actually generating pipeline activity.
A common pattern I see in early-stage businesses is that a company generates lots of leads but very few demo requests. When you dig into the funnel, the gap is almost always at the trust stage. Leads are subscribing but not engaging deeply enough with content to feel ready to see the product. The fix isn't more leads–it's actually producing better trust-stage content.
Time to First Response
This metric sits at the intersection of marketing and sales, and it's one of the most impactful numbers in your entire operation.
Research on inbound lead response consistently shows that the likelihood of connecting with and qualifying a lead drops dramatically after the first five minutes. The leads who fill out your demo request form are in a decision-making mode at that exact moment. They've just done the most motivated thing they'll ever do in your funnel. If they don't hear back within minutes, that motivation fades, their next meeting starts, or they move on to reaching out to your competitor they were also evaluating.
Setting up instant notifications when a demo request comes in (via email, Slack, or a CRM mobile alert) is a straightforward technical task that pays off immediately. If your team can't respond within 5 minutes during business hours, build a calendar booking tool into the demo request flow so the lead can self-schedule instead of waiting for someone to reach out.
Discovery-to-Proposal Rate
This metric indicates the percentage of discovery calls that result in a formal proposal. If you're running 10 discovery calls a month and only 2 result in a proposal, something is wrong.
The most common cause of a low discovery-to-proposal rate is an upstream qualification problem. The wrong leads are getting into the sales conversation. These folks might not be a fit for the product, don't have the budget, are at a company that's too small or too large, or are at the wrong stage of the buying process. The fix is almost never in the sales script. It's in the qualification criteria at the top of the funnel.
Look at the leads who didn't convert to proposals and ask yourself what they had in common. Were they from a particular traffic source? A particular industry? A particular job title? The pattern will tell you which channel or content piece is generating low-quality leads, so you can either stop using it or recalibrate it.
Win Rate
Win rate is the percentage of proposals that close as won deals. It's one of the most watched metrics on any sales team's dashboard, and it's also commonly misinterpreted.
When the win rate drops, the instinct is to blame the sales team. A declining win rate is often a signal that something has changed in the market, in the competitive landscape, or in the quality of leads entering the pipeline. Marketing and product both have a role to play in win rate, even if the number sits on the sales dashboard.
Check the following when the win rate is declining:
Are you losing more deals to specific competitors? That's a positioning and differentiation issue marketing can address with comparison content.
Are you losing deals late in the process, after multiple calls? That's often a trust or proof issue, meaning leads are interested but not convinced.
Are you losing deals to 'no decision'? That usually means the urgency or business case wasn't compelling enough, which is a messaging problem.
Closed-Lost Reason
Most early-stage companies treat closed-lost data as an administrative afterthought. It's not. It's the most direct feedback loop available between what your market is telling you and what your marketing should say.
Here's how to think about each common closed-lost reason and what it means for your content strategy.
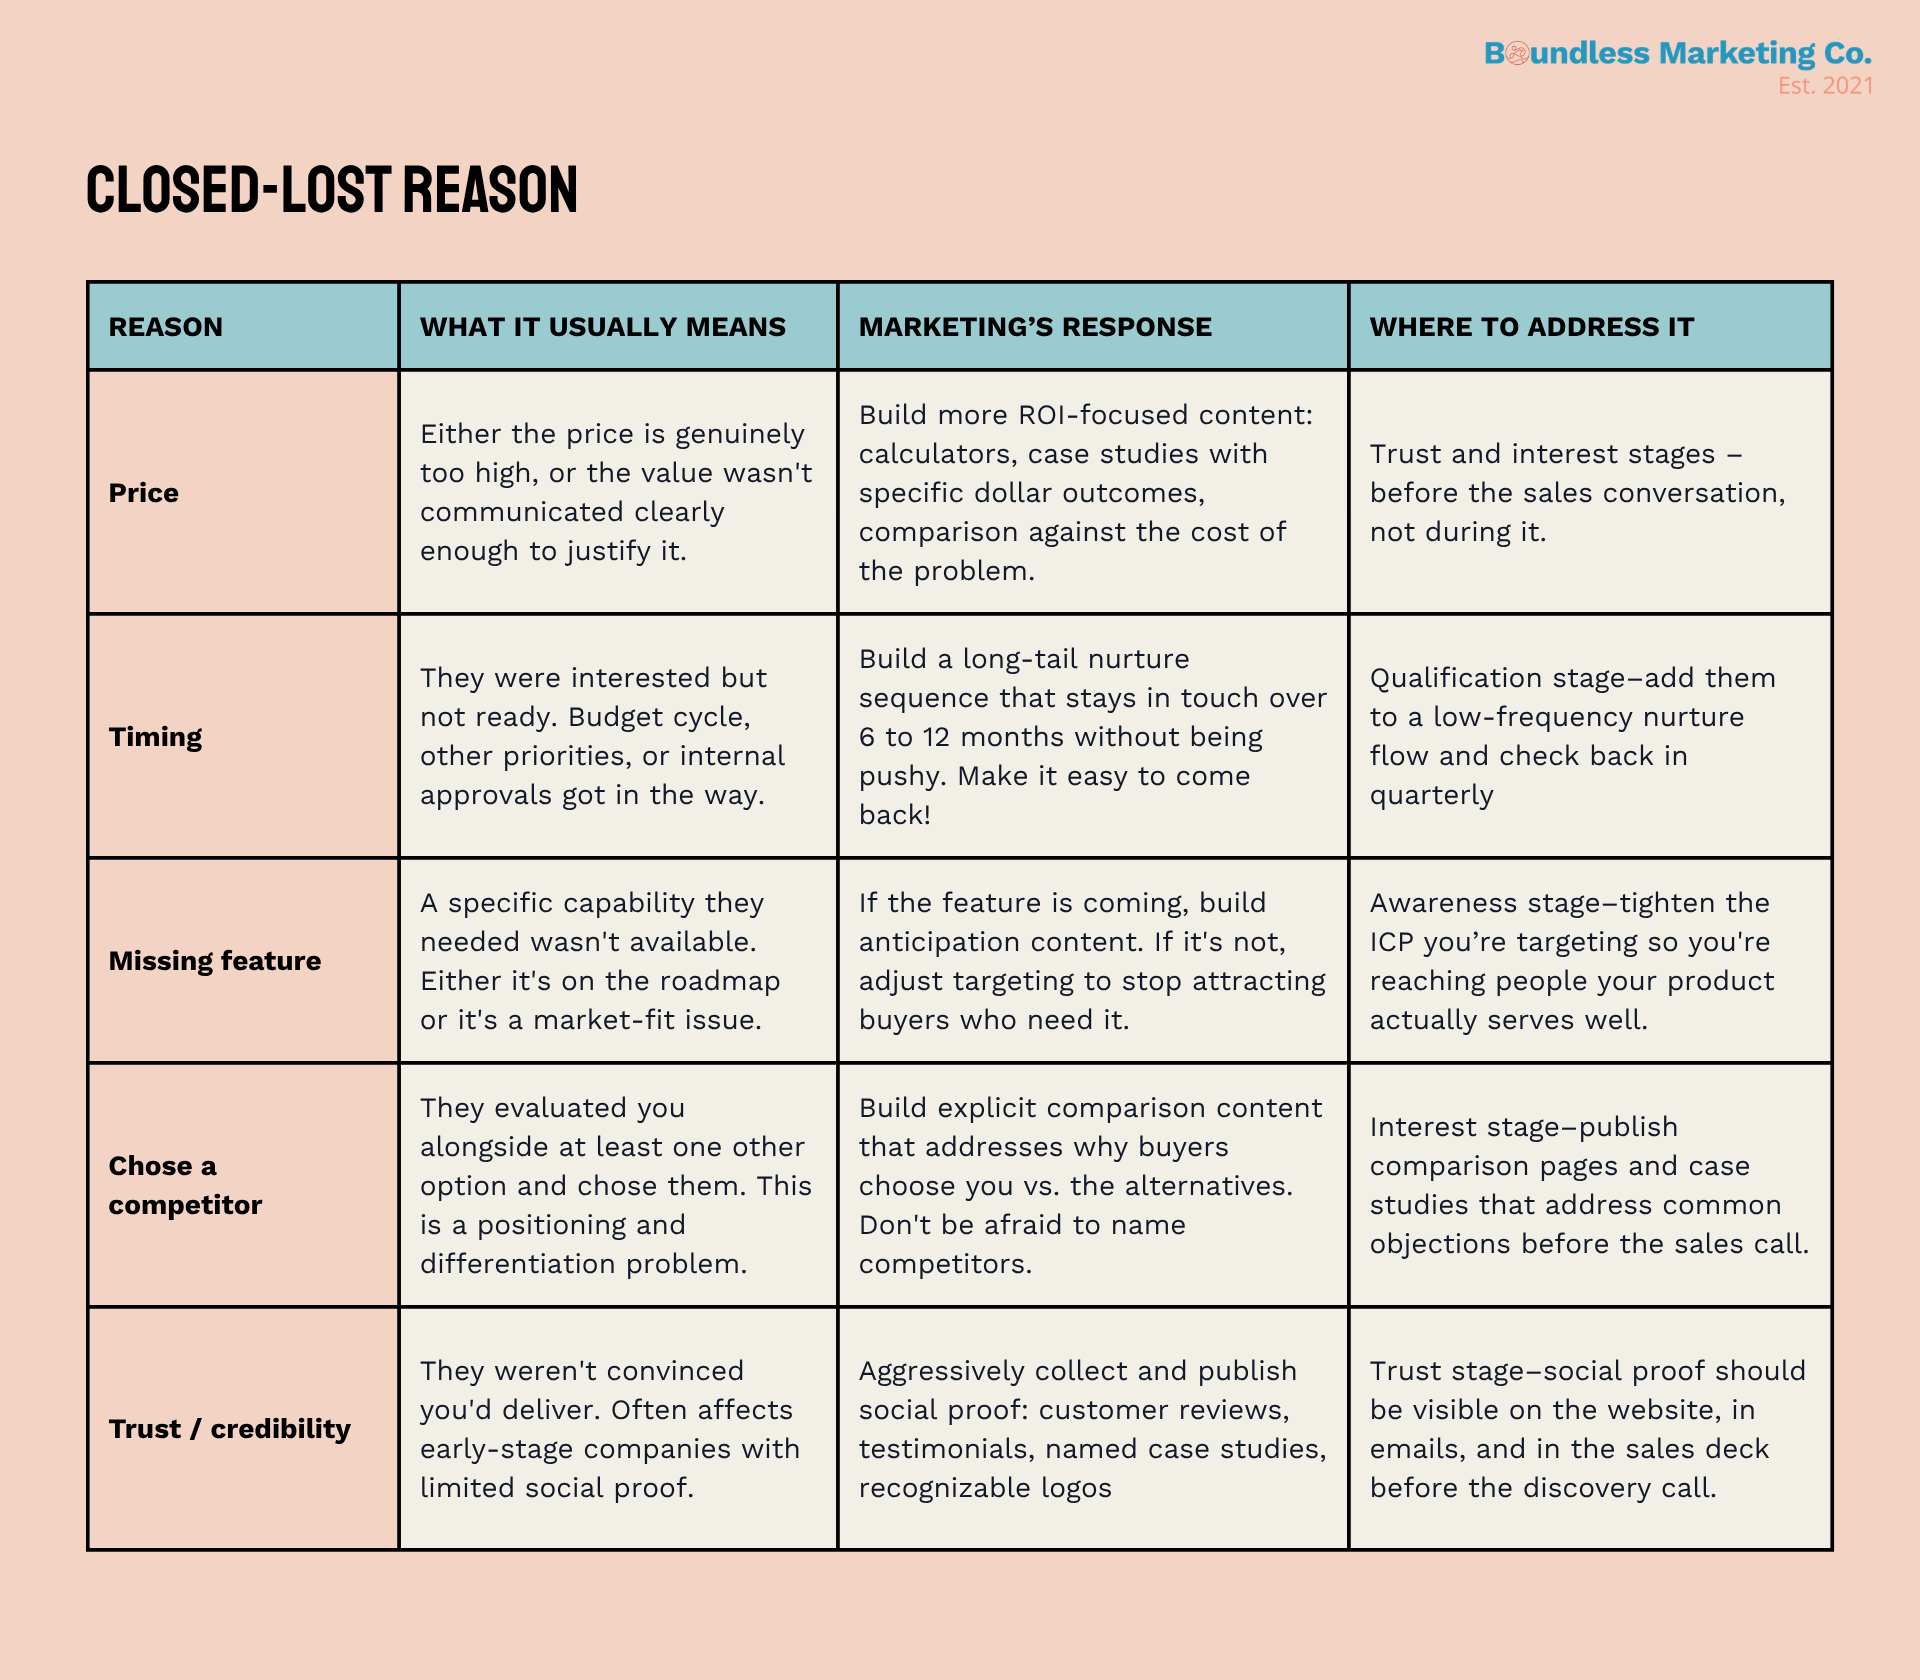
The process for making this work is simple: make “closed-lost reason” a required field in your CRM deal records, give your sales team a defined list of reasons to choose from (rather than a free-text field), and review the data monthly. After 90 days, you'll have a clear picture of which objections are most common and exactly where in the funnel marketing needs to focus.
Average Sales Cycle Length
Average sales cycle length indicates how long it takes, on average, from first contact to closing the deal. For most B2B companies, it's somewhere between 30 and 120 days, depending on deal size, number of stakeholders, and product complexity.
This metric matters to marketing in two specific ways. First, it tells you how long your nurture sequences need to be to sustain engagement. If your average sales cycle is 90 days, a 14-email nurture sequence spread over three weeks won't cover the distance. You need content that remains relevant and valuable for 3 months.
Second, changes in average sales cycle length are a leading indicator of problems elsewhere. If your sales cycle suddenly gets longer, it could mean leads are arriving less informed than before (a content quality issue), that sales are taking longer to follow up (a process issue), or that your market is becoming more competitive (a positioning issue). The number itself doesn't tell you which, but it tells you to start looking.
How Marketing Moves the Bottom-of-Funnel Numbers
One of the most common misconceptions about bottom-of-funnel metrics is that they belong exclusively to sales. They don't! Marketing has a direct influence on each of these numbers, though not always in immediately obvious ways.
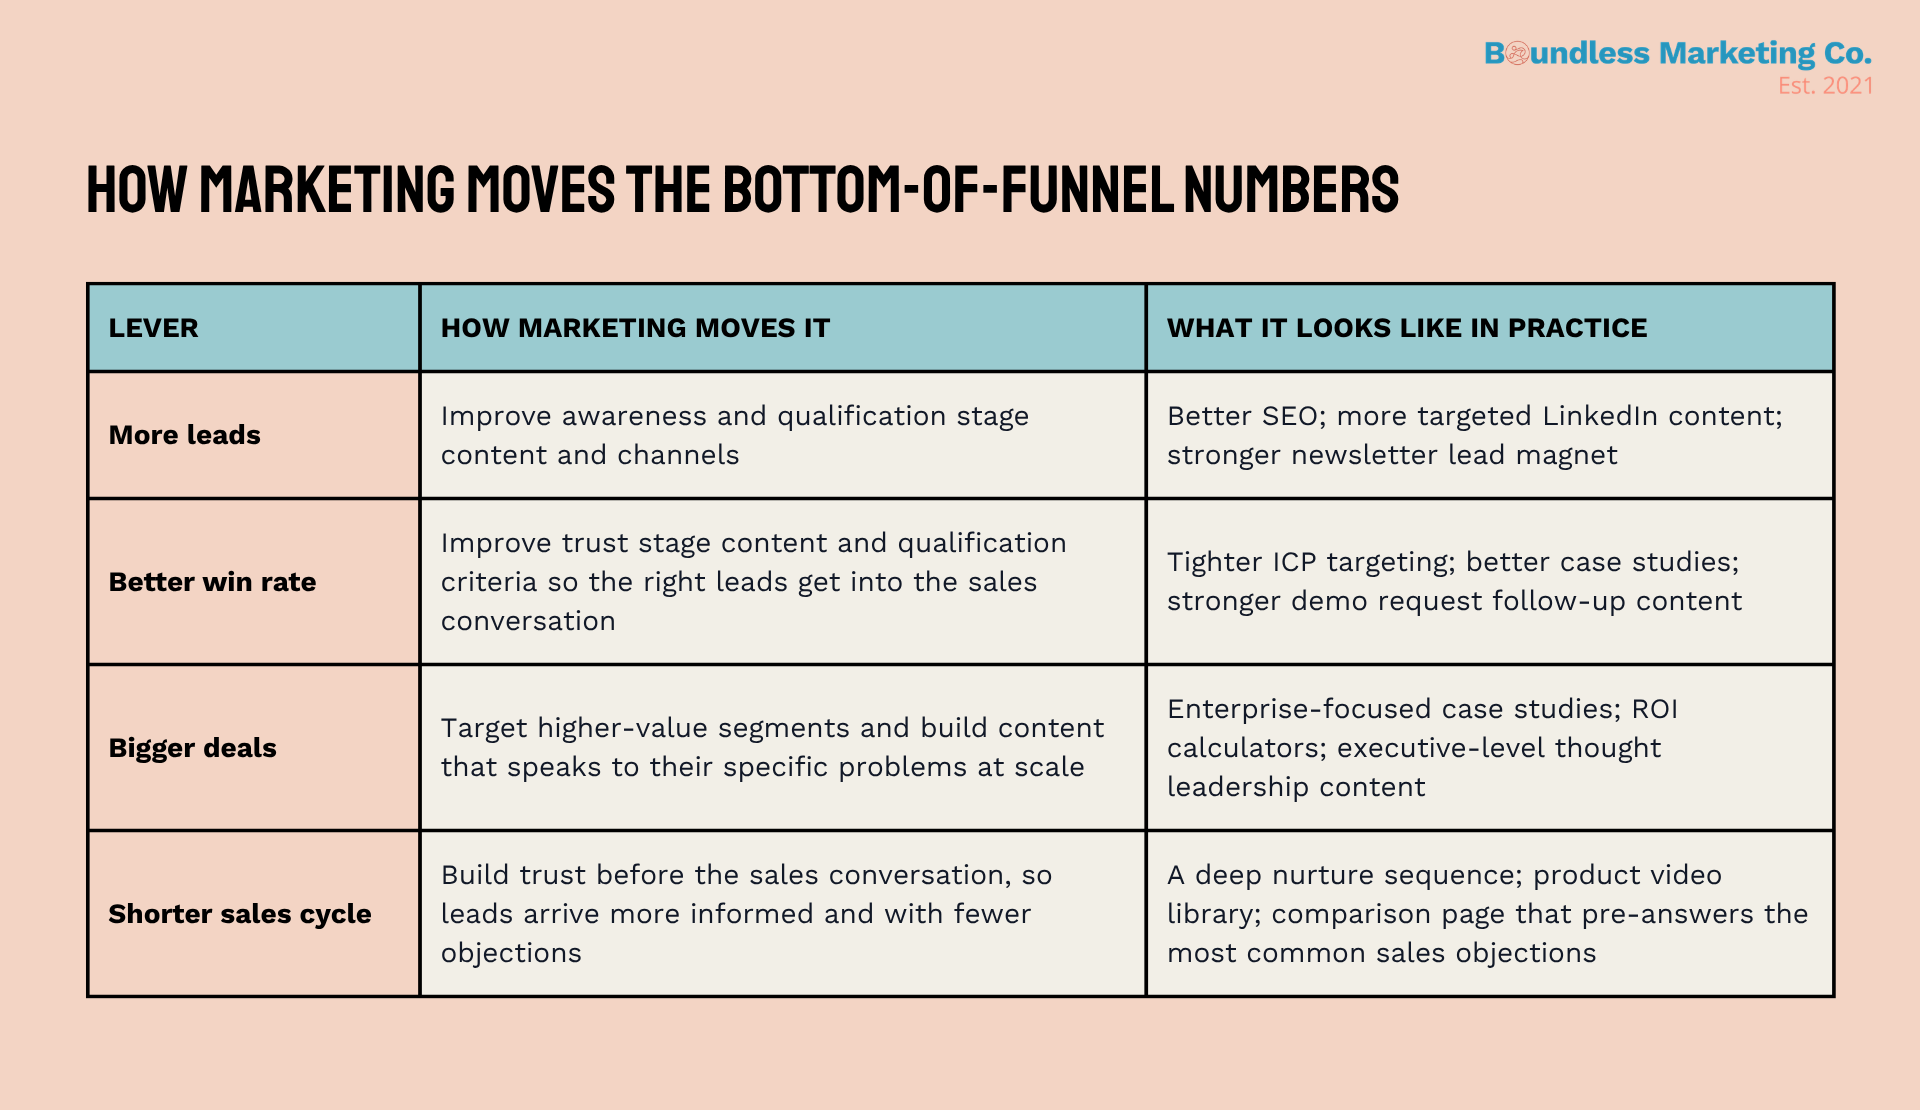
Marketing isn’t about closing deals, but about shaping the conditions that make deals easier to close.
Putting It Together: The Pipeline Velocity Formula
There's a single formula that combines all these metrics into one number: pipeline velocity. It shows how much revenue your pipeline generates per day.
Pipeline Velocity = (Number of Leads x Win Rate % x Average Deal Size) / Sales Cycle Length (in days)
To increase velocity, you either need more leads, a better win rate, bigger deals, or a shorter sales cycle.
The most useful calibration habit is a monthly sales-marketing alignment check. Sit down together and ask: of the leads that hit 100 points this month, how many were actually ready to talk? If sales consistently say the leads are too cold, your scoring is too generous. If they're saying they wish they'd been alerted earlier, your threshold is too high. Adjust accordingly and revisit again next month.
What Lead Scoring Won't Fix
It's worth being clear about the limits of lead scoring because it's sometimes oversold as a cure-all
Lead scoring won't fix a traffic quality problem. If the leads entering your funnel are the wrong people to begin with, their scores will never reflect genuine purchase intent, no matter how well your model is built. Scoring is a filter for leads that are already in the funnel. It's not a substitute for targeting the right audience at the top.
Lead scoring also won't fix a sales process problem. If leads are reaching 100 points and sales are contacting them but not converting them, the problem is likely in the sales conversation, the product demo, or the pricing structure, not in the scoring model. Don't blame the model for problems that live downstream.
What lead scoring does well is help your team focus. It reduces the time spent on leads who aren't ready, speeds up outreach to leads who are, and creates a shared language between marketing and sales for discussing lead quality. That's a significant win for any early-stage team that doesn't have the bandwidth to treat every lead with equal attention.
The Bottom Line
Lead scoring doesn't have to be complicated to be effective. A simple model with 10 to 15 rules, properly configured decay, and a clear handoff threshold will outperform a spreadsheet-based approach any day. And unlike many marketing tools, it gets better over time.
Up Next: Part 9 goes deeper on lead scoring specifically -- how to build a model from scratch, how to set the right sales-ready threshold, and how to make sure your hot leads list actually stays hot.
About This Series: This post is part of The Startup Marketing Playbook, a 12-part newsletter and blog series for tech and SaaS founders. Each installment covers one core concept in depth, with actionable frameworks you can apply immediately.