
Pipeline Velocity: The One Marketing Metric That Tells You Everything About Your Startup's Growth
PART 11 OF 12 | THE STARTUP MARKETING PLAYBOOK | BLOG POST

The Problem With Tracking Too Many Metrics
By the time a startup has been running marketing for six months, it usually has too many metrics, not too few. There's a dashboard for social media, a dashboard for email, a CRM with a dozen deal stage reports, and a Google Analytics account that nobody fully understands. Everyone is looking at something different, and nobody can agree on whether marketing is actually working.
Pipeline velocity is the antidote to that. It's a single formula that pulls the most important inputs from your entire funnel into one number -- and more importantly, it tells you exactly which input to improve when that number isn't where you want it to be.
It's the closest thing to a true north star metric that startup marketing has.
The Pipeline Velocity Formula
Pipeline velocity measures how much revenue your pipeline is generating per day. Here's the formula:
Pipeline Velocity = (Number of Leads x Win Rate % x Average Deal Size) / Sales Cycle Length (in days)
Let's put some numbers to it. Say you have 100 qualified leads in your pipeline, a 25% win rate, an average deal size of $10,000, and an average sales cycle of 60 days. Your pipeline velocity looks like this:
(100 x 0.25 x $10,000) / 60 = $4,167 per day
Your pipeline is generating roughly $4,167 per day, or about $125,000 per month if velocity remains constant. That's your baseline. Now, what happens if you improve each lever by a meaningful amount?
Double the lead volume to 200: velocity jumps to $8,333 per day.
Improve win rate from 25% to 35%: velocity goes from $4,167 to $5,833 per day.
Increase average deal size from $10,000 to $12,500: velocity goes from $4,167 to $5,208 per day.
Cut the sales cycle from 60 days to 45 days: velocity goes from $4,167 to $5,556 per day.
Every lever moves the number. The question is which lever is most accessible given your current situation–and that's where the diagnostic work comes in.
The Four Levers and Marketing's Role in Each
One of the most common misconceptions about pipeline velocity is that it's a sales metric. It's not. Marketing has a direct influence on all four inputs. Here's how.
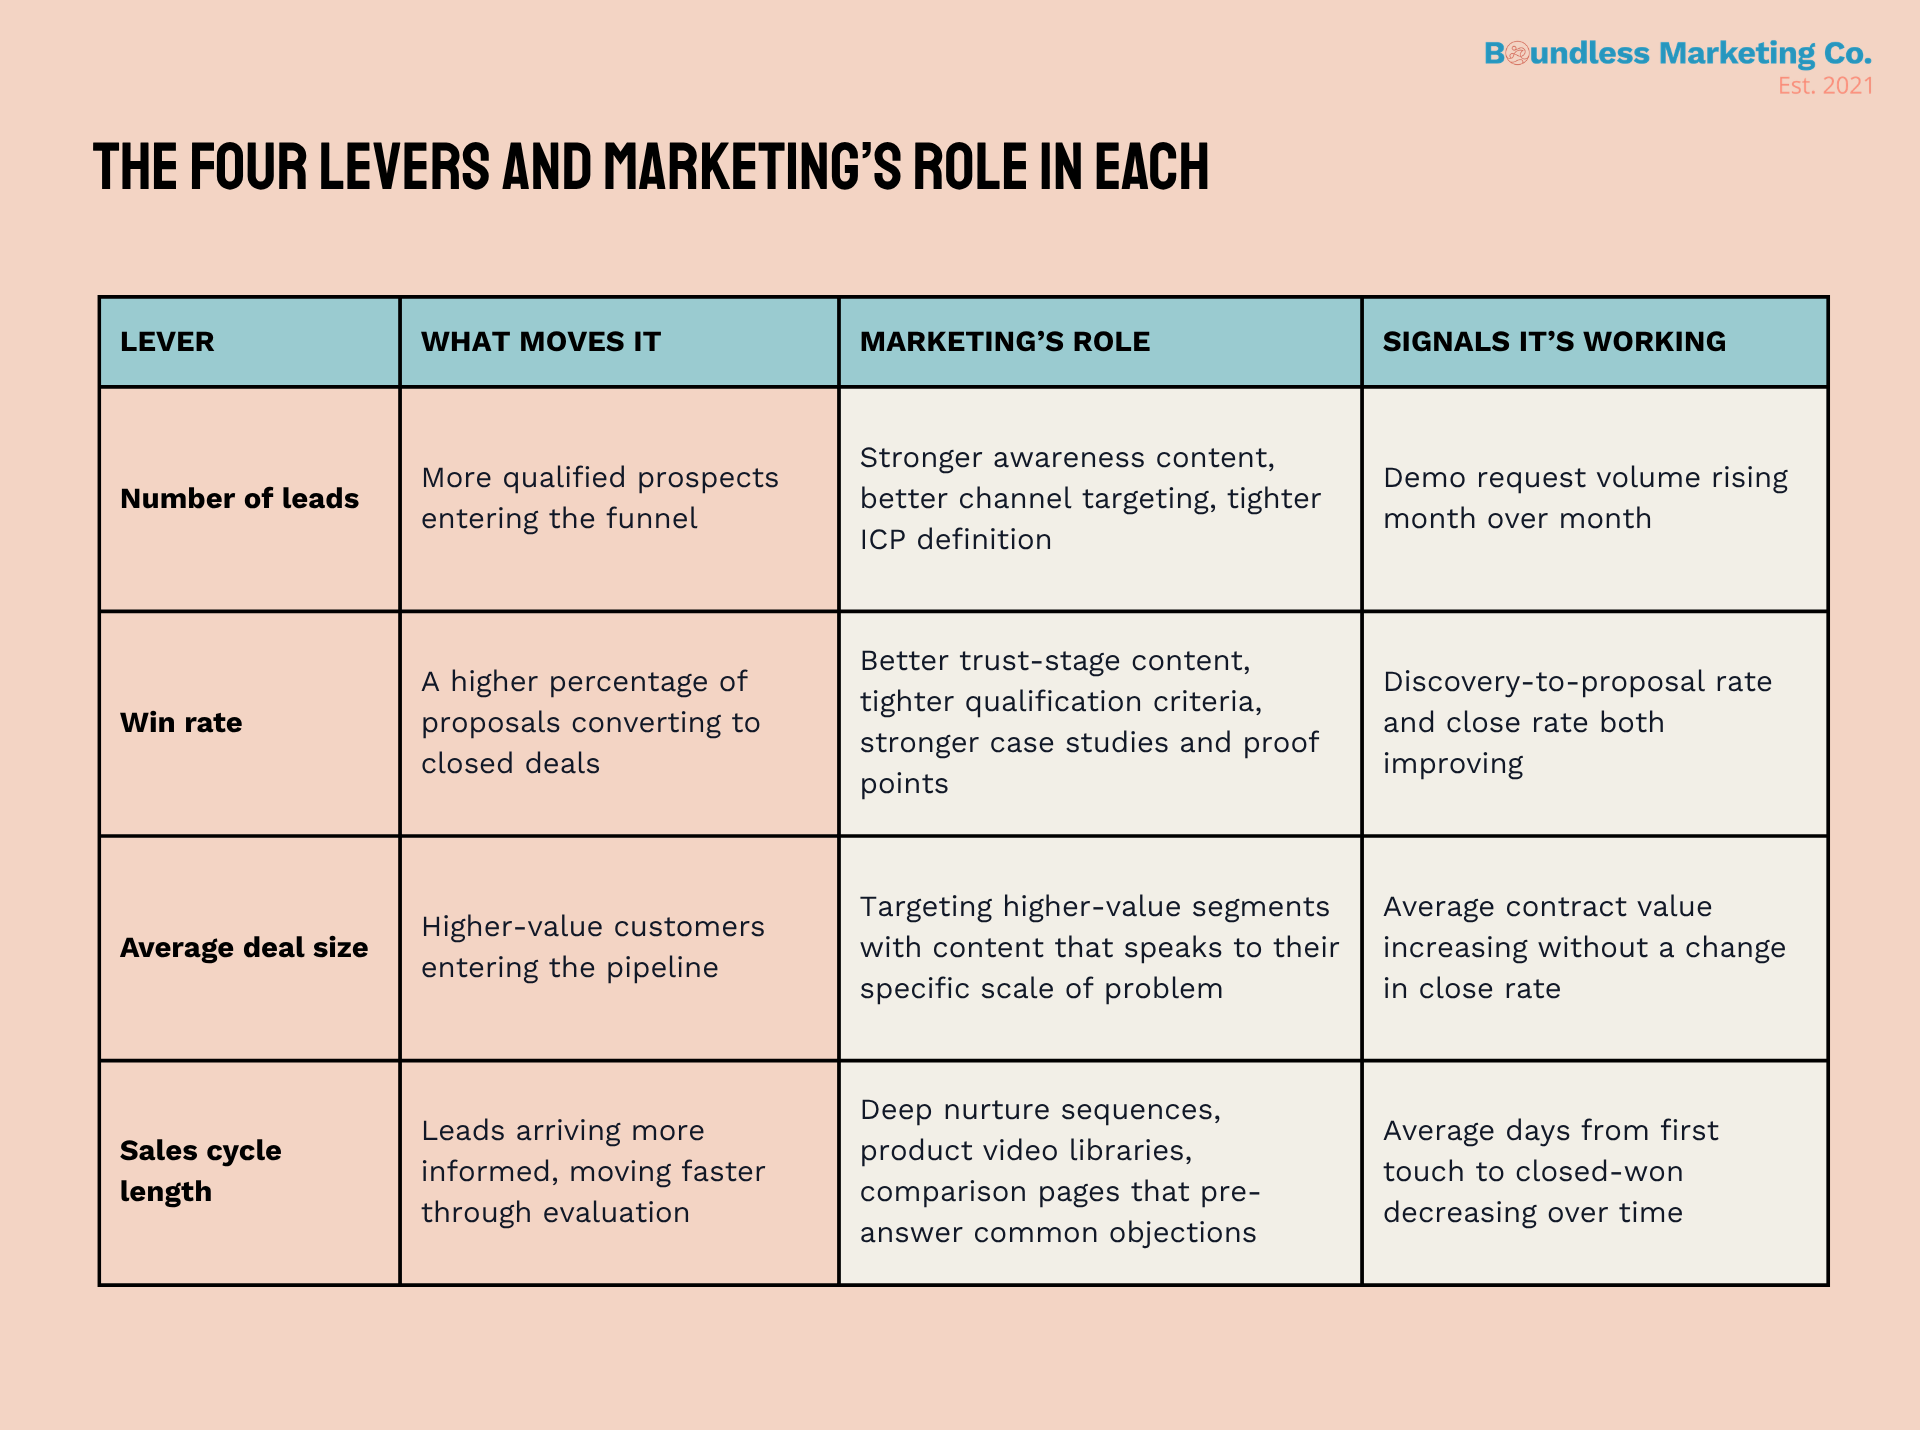
The most important thing to notice is that marketing's influence on velocity is almost entirely upstream. You're not closing deals; rather, you're shaping the conditions that make deals easier, faster, and more valuable to close. The better your content and targeting, the better every sales metric gets.
How to Use Pipeline Velocity as a Diagnostic Tool
The real power of the formula isn't in the number it produces–it's in what happens when you look at the individual inputs and ask why each one is where it is.
When the velocity is lower than you want, something is broken in the formula. The goal is to identify which input is the culprit and fix that specific problem rather than guessing or doing more of everything
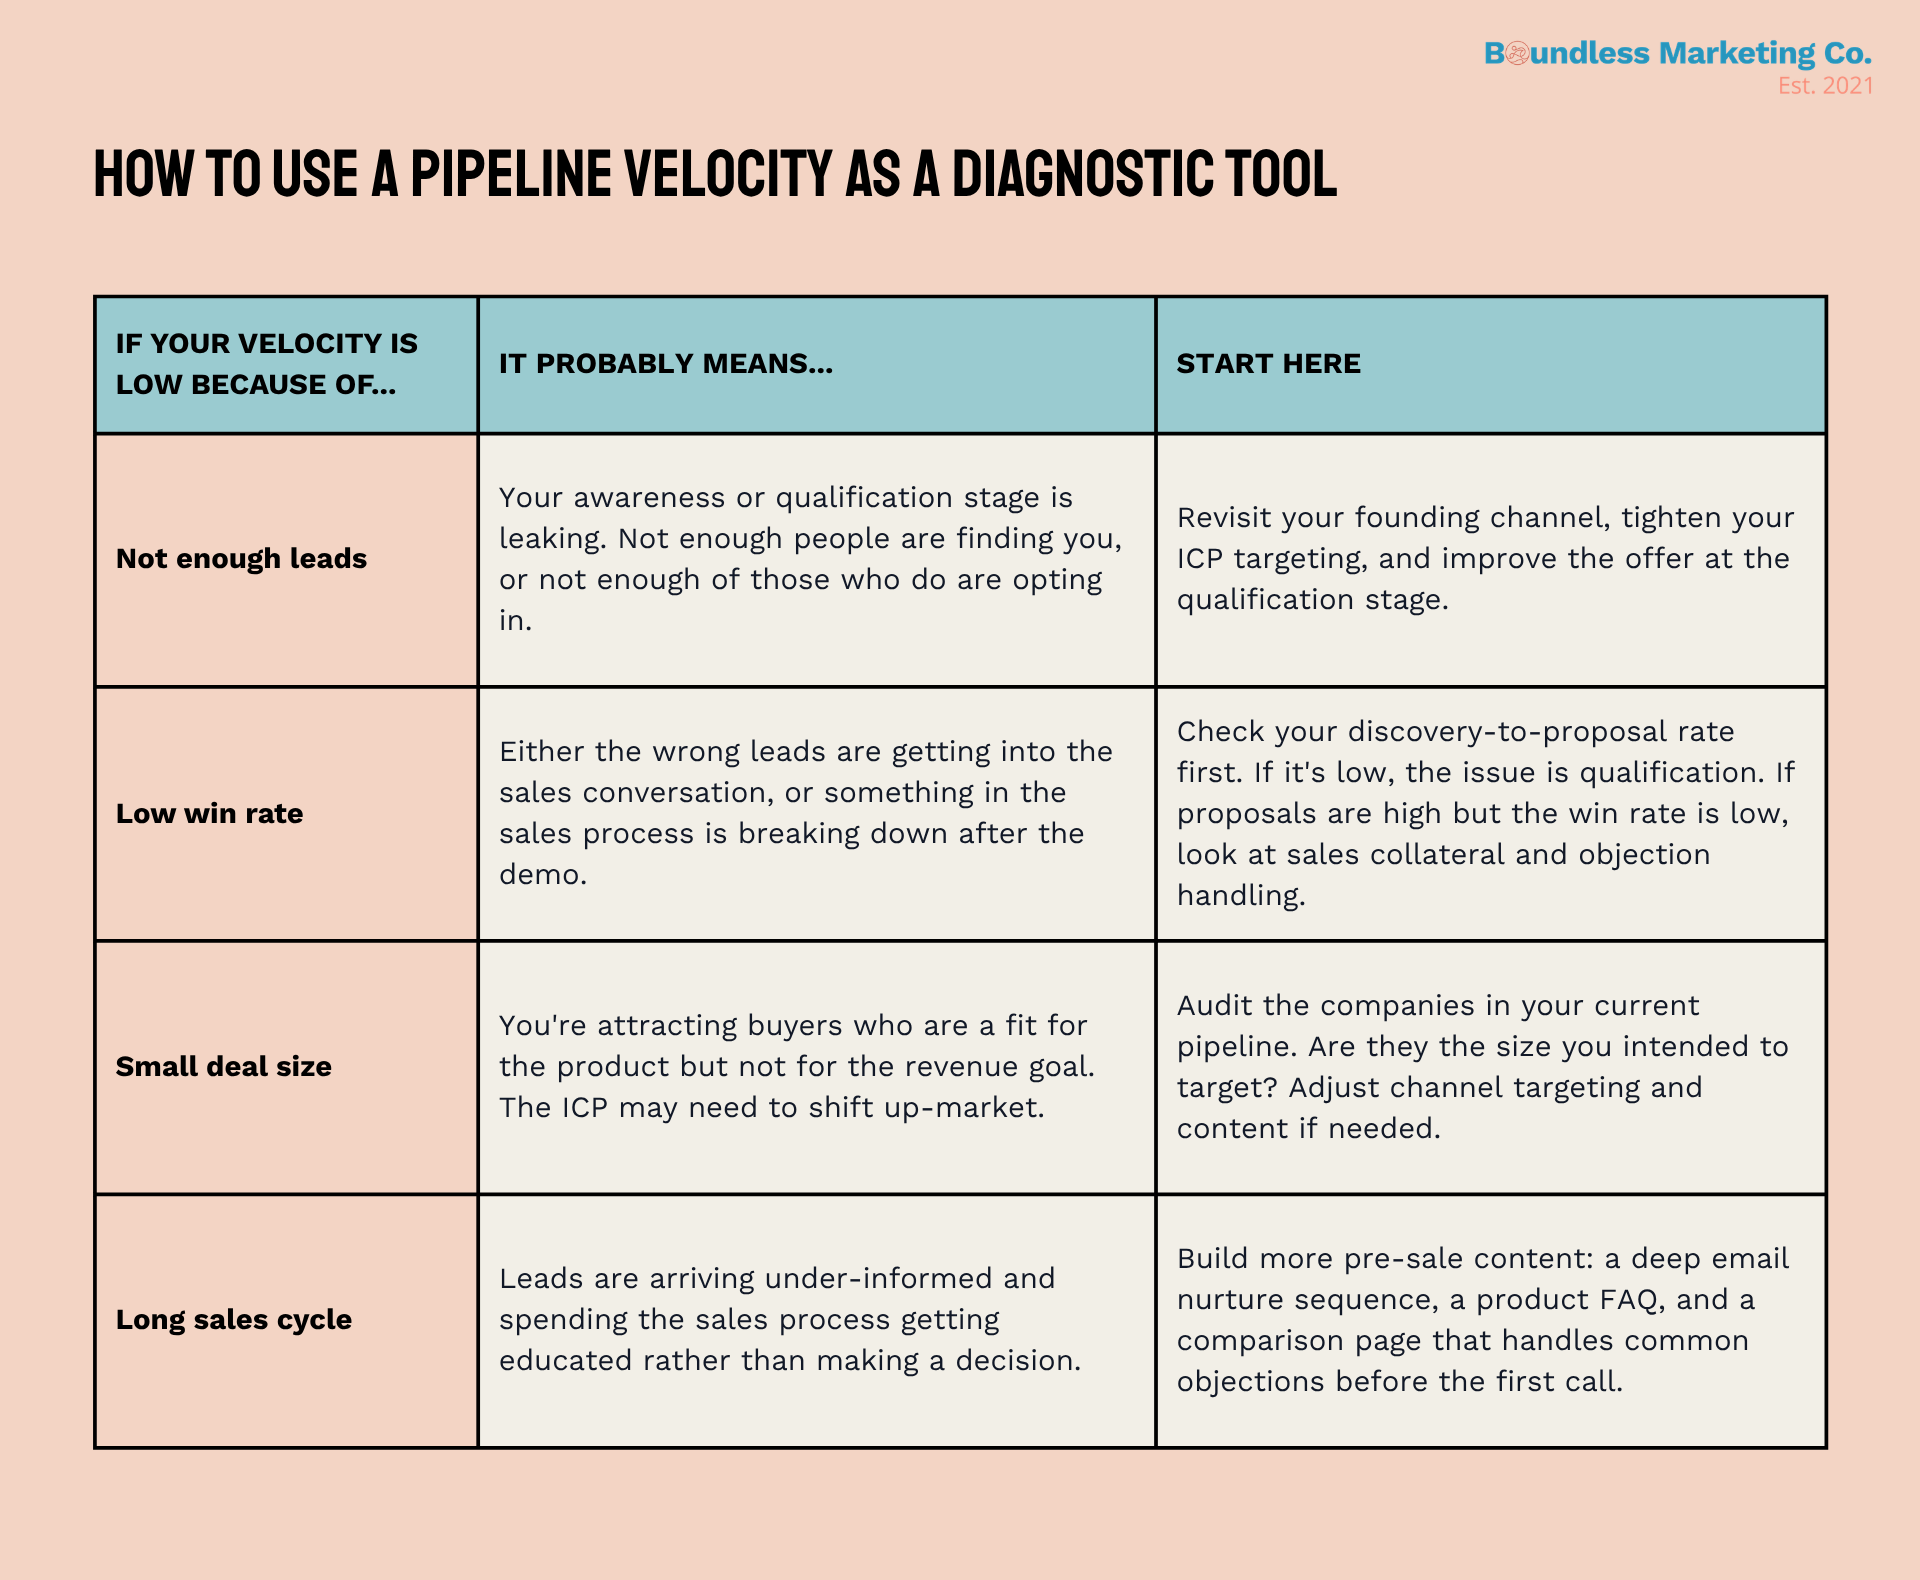
The diagnostic process is simple: calculate velocity this month, then compare it to the same inputs from three months ago. Which number changed the most? That's where to focus. If lead volume is flat but win rate dropped, the problem is in the quality of leads or the sales process -- not in your awareness marketing. If lead volume grew but sales cycle got longer, you've got a qualification or nurture problem, not a channel problem.
Tracking Velocity Over Time
Calculating pipeline velocity can be interesting. But tracking it monthly is transformative.
Set up a simple tracking sheet with five columns: month, lead volume, win rate, average deal size, sales cycle length, and calculated velocity. Update it at the end of every month with actual numbers from your CRM. After three months, you'll have a trend line. After six months, you'll have enough data to identify seasonal patterns, measure the impact of specific campaigns, and predict revenue with a meaningful degree of confidence.
The monthly review should become a standing agenda item in your marketing and sales alignment meeting. The questions to answer each month are always the same:
Did velocity increase or decrease from last month?
Which input drove the change?
What specifically did we do in the last 30 days that could explain the movement?
What's the one input we should focus on improving next month?
That last question is the most important one. Pipeline velocity is most valuable as a prioritization tool. It tells you where to spend your limited time and budget, rather than leaving you guessing about what to work on next.
The Relationship Between Velocity and the North Star Goal
In Part 1 of this series, we talked about connecting every marketing activity to a company revenue goal. Pipeline velocity is the mechanism that closes that loop.
If your north star goal is $2M in ARR, you need to generate roughly $167,000 in new revenue per month. Divide that by 30 days, and you need a daily velocity of about $5,556. If your current velocity is $3,000 per day, you have a $2,556 per-day gap. The formula tells you exactly how much improvement you need across the four levers to close that gap.
You could close it by increasing lead volume by 85%. Or by improving the win rate from 20% to 37%. Or by increasing average deal size from $8,000 to $14,800. Or by cutting your sales cycle from 90 days to 48 days. Or by some combination of all four.
The point isn't that any of those targets is easy. It's that they're specific and measurable, which means you can build a plan against them rather than just hoping your marketing output will somehow add up to a revenue outcome.
Pipeline velocity turns your revenue goal from an abstract number into a set of specific, measurable levers. That's the difference between a marketing plan and a marketing strategy.
A Note on What Velocity Doesn't Tell You
Pipeline velocity is a powerful diagnostic tool, but it has limits.
It doesn't tell you about lead quality within the lead volume number. One hundred highly qualified leads and one hundred poorly qualified leads will look the same in the formula until you see the win rate. Always look at both lead volume and win rate together rather than optimizing for lead volume in isolation.
It also doesn't tell you about customer lifetime value or churn. A fast pipeline that generates customers who cancel in three months isn't a healthy business, even if velocity looks strong. Use pipeline velocity alongside retention metrics, not instead of them.
And it doesn't account for the lag between marketing actions and pipeline outcomes. Most marketing activities take weeks or months to show up in the velocity number. Don't make decisions based on a single month's data. Look at trends over a quarter or more before drawing conclusions.
The Bottom Line
Pipeline velocity won't solve your marketing problems on its own. But it will tell you which problem to solve first, and that's more valuable than any tactic, channel, or tool on the market.
Calculate it this week. Track it every month. Let the formula tell you where to focus. And then build the mini-plans, the content, and the channel strategy around moving the specific lever that matters most right now.
That's what it means to treat marketing as a profit center rather than a cost center.
Up Next: Part 12 is the final installment. We're closing with the product demo -- the most important single sales tool most startups have, and the one most of them are executing wrong. See you next week.
About This Series: This post is part of The Startup Marketing Playbook, a 12-part newsletter and blog series for tech and SaaS founders. Each installment covers one core concept in depth, with actionable frameworks you can apply immediately.