
The Founder's Guide to Awareness and Engagement Metrics (Beyond Vanity Numbers)
PART 8 OF 12 | THE STARTUP MARKETING PLAYBOOK | BLOG POST

Why Most Startup Metric Dashboards Are Lying to You
Here's a dashboard that looks great on paper: 10,000 Twitter followers, 50,000 monthly website visits, 5,000 email subscribers.
And…here's the same dashboard's problem: none of those numbers tells you whether you're reaching your ideal customer, whether any of those people are actually paying attention to you, or whether any of them are likely to buy.
Vanity metrics are metrics that are easy to count, easy to report, and easy to inflate. Real, impactful metrics are the ones that correlate with actual business outcomes. The difference between the two isn't always obvious, especially early on, when every new follower feels like a win.
Read on to learn about how to clearly draw that distinction at the two most commonly misread stages of the funnel: awareness and engagement.
Stage 1: Awareness Metrics
Awareness metrics answer one question: are the right people aware that you exist? Here are the four metrics that actually tell you that.
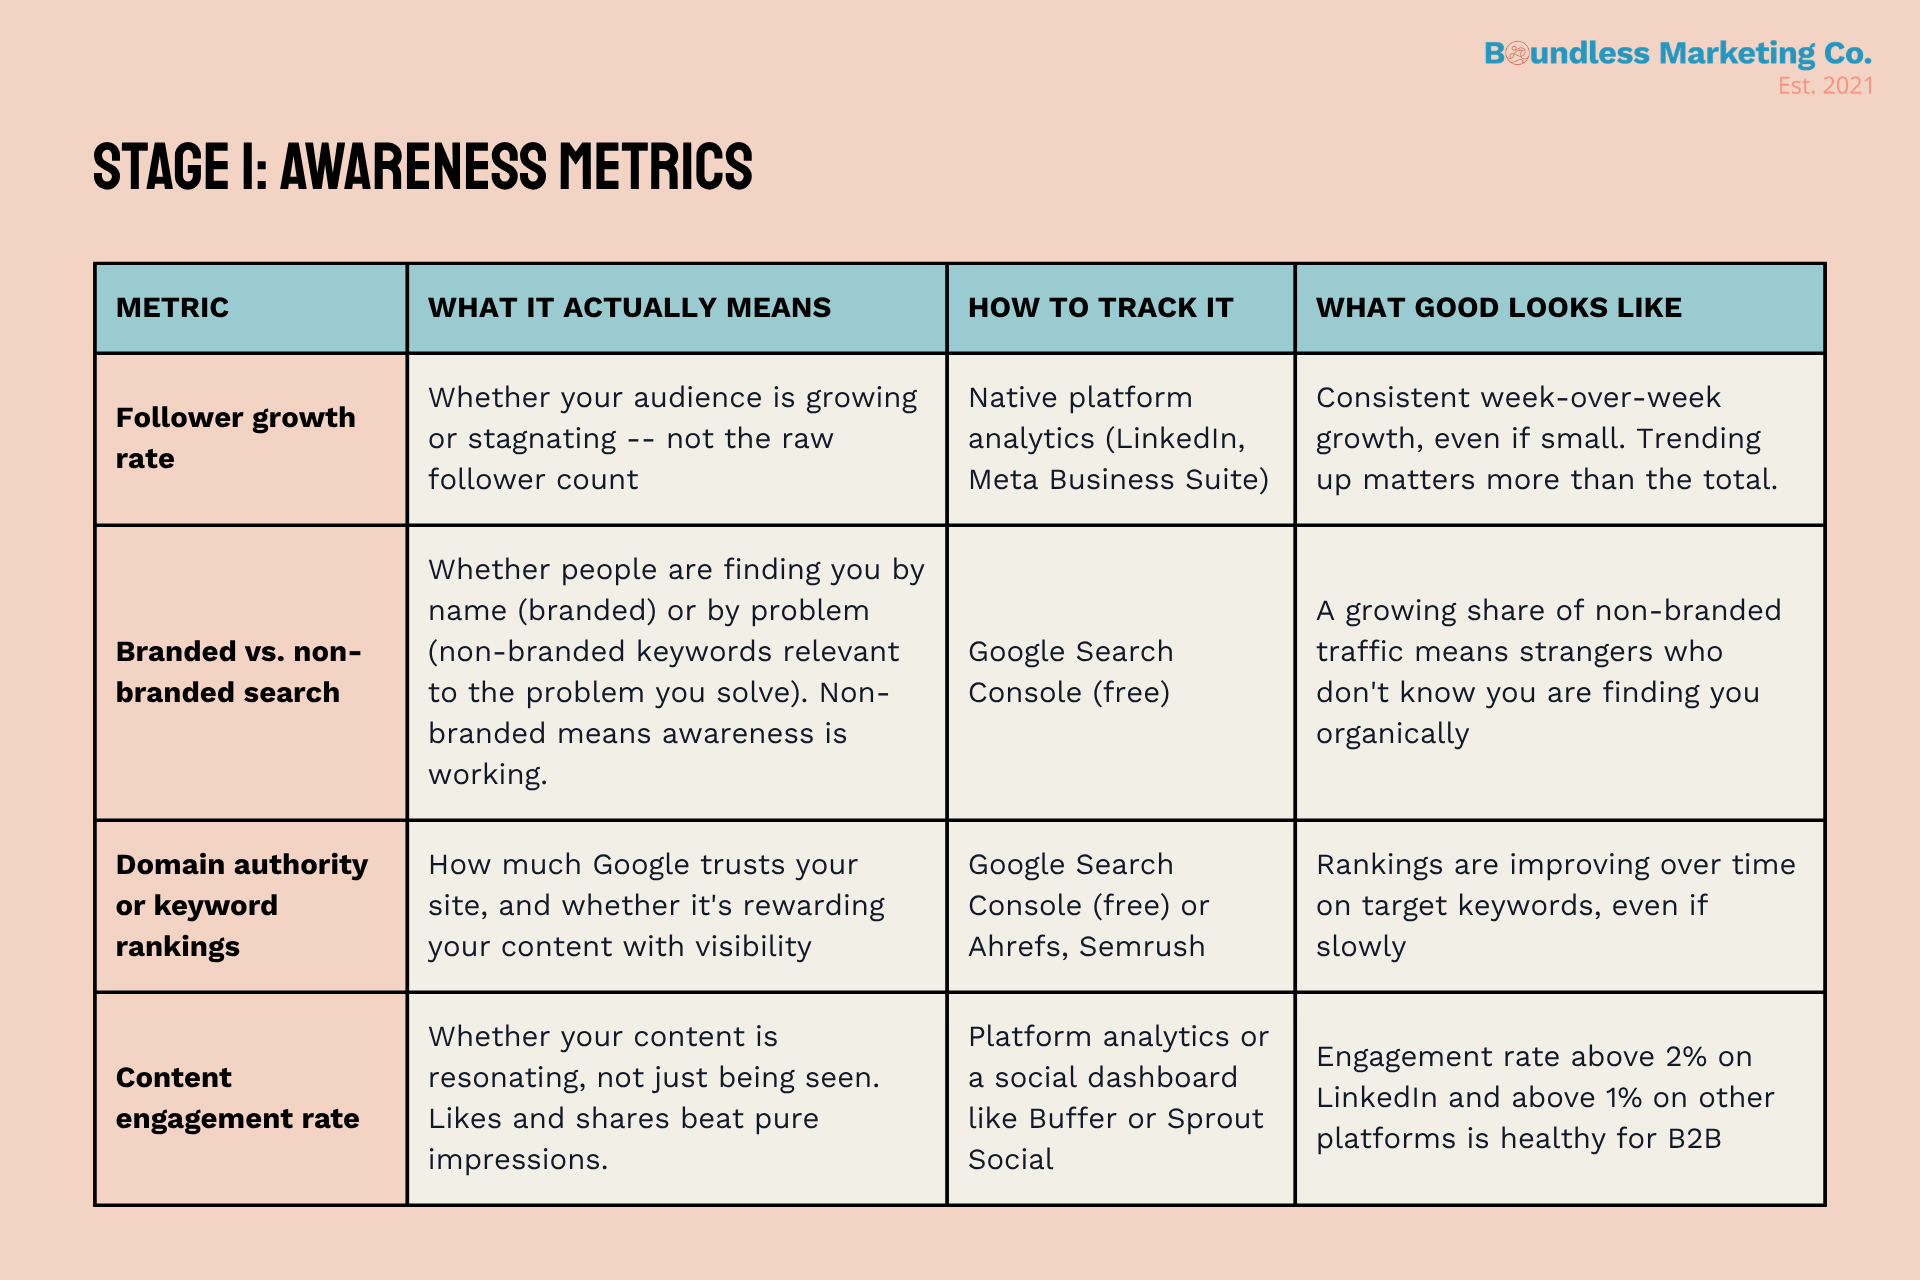
Follower Growth Rate vs. Follower Count
Total follower count is a snapshot. Follower growth rate is a trend. And trends are almost always more useful than snapshots.
The formula is simple: new followers in a period divided by total followers at the start of that period. A company with 500 followers growing at 8% per week is on a much healthier trajectory than a company with 5,000 followers growing at 0.5% per week. The first company will have more followers within months, and more importantly, it has momentum.
What you want to see in the early stages is consistent week-over-week growth—even if the absolute numbers are small. A flat or declining follower growth rate is a signal that your content isn't resonating or that you're not reaching new people in your target audience.
Branded vs. Non-Branded Search
This is one of the most underused metrics available to early-stage startups, and it's completely free to track through Google Search Console.
Branded search includes any query that contains your company or product name. Non-branded search includes queries about the problem you solve, without any mention of your brand. 'Best project management software for agencies' is non-branded. 'Asana project management' is branded.
If all your organic search traffic is branded, it means the only people finding you through Google are people who already know you exist. Your awareness marketing isn't generating any new discovery. Non-branded search traffic means strangers are finding you through your content. That's the signal you're trying to grow.
If someone can only find you by searching your name, your awareness marketing isn't working yet. The goal is to show up for the problems your buyers are searching for before they know your solution exists.
Domain Authority and Keyword Rankings
Domain authority is a score developed by SEO tools like Moz, Ahrefs, and Semrush that estimates how likely your website is to rank in search results. It's based on the quantity and quality of other sites that link to yours. The higher your domain authority, the more likely Google is to trust your content and rank it for relevant queries.
For early-stage startups, absolute domain authority scores are less important than the direction of travel. Is it growing? Are you starting to rank for any of the keywords your ideal customers search for? Even a ranking on page two for a low-volume, high-intent keyword is a signal worth celebrating and building on.
Start by identifying five to ten keywords your ideal customers realistically search for when they're experiencing the problem you solve. Track your rankings for those specific keywords monthly using Google Search Console or a free tier of any major SEO tool. Improvement over time, even if minimal, tells you that your content strategy is working.
Stage 2: Engagement Metrics
Engagement metrics answer a different question: once someone has opted in to hear from you, are they actually paying attention? Here are the four metrics that tell you that.
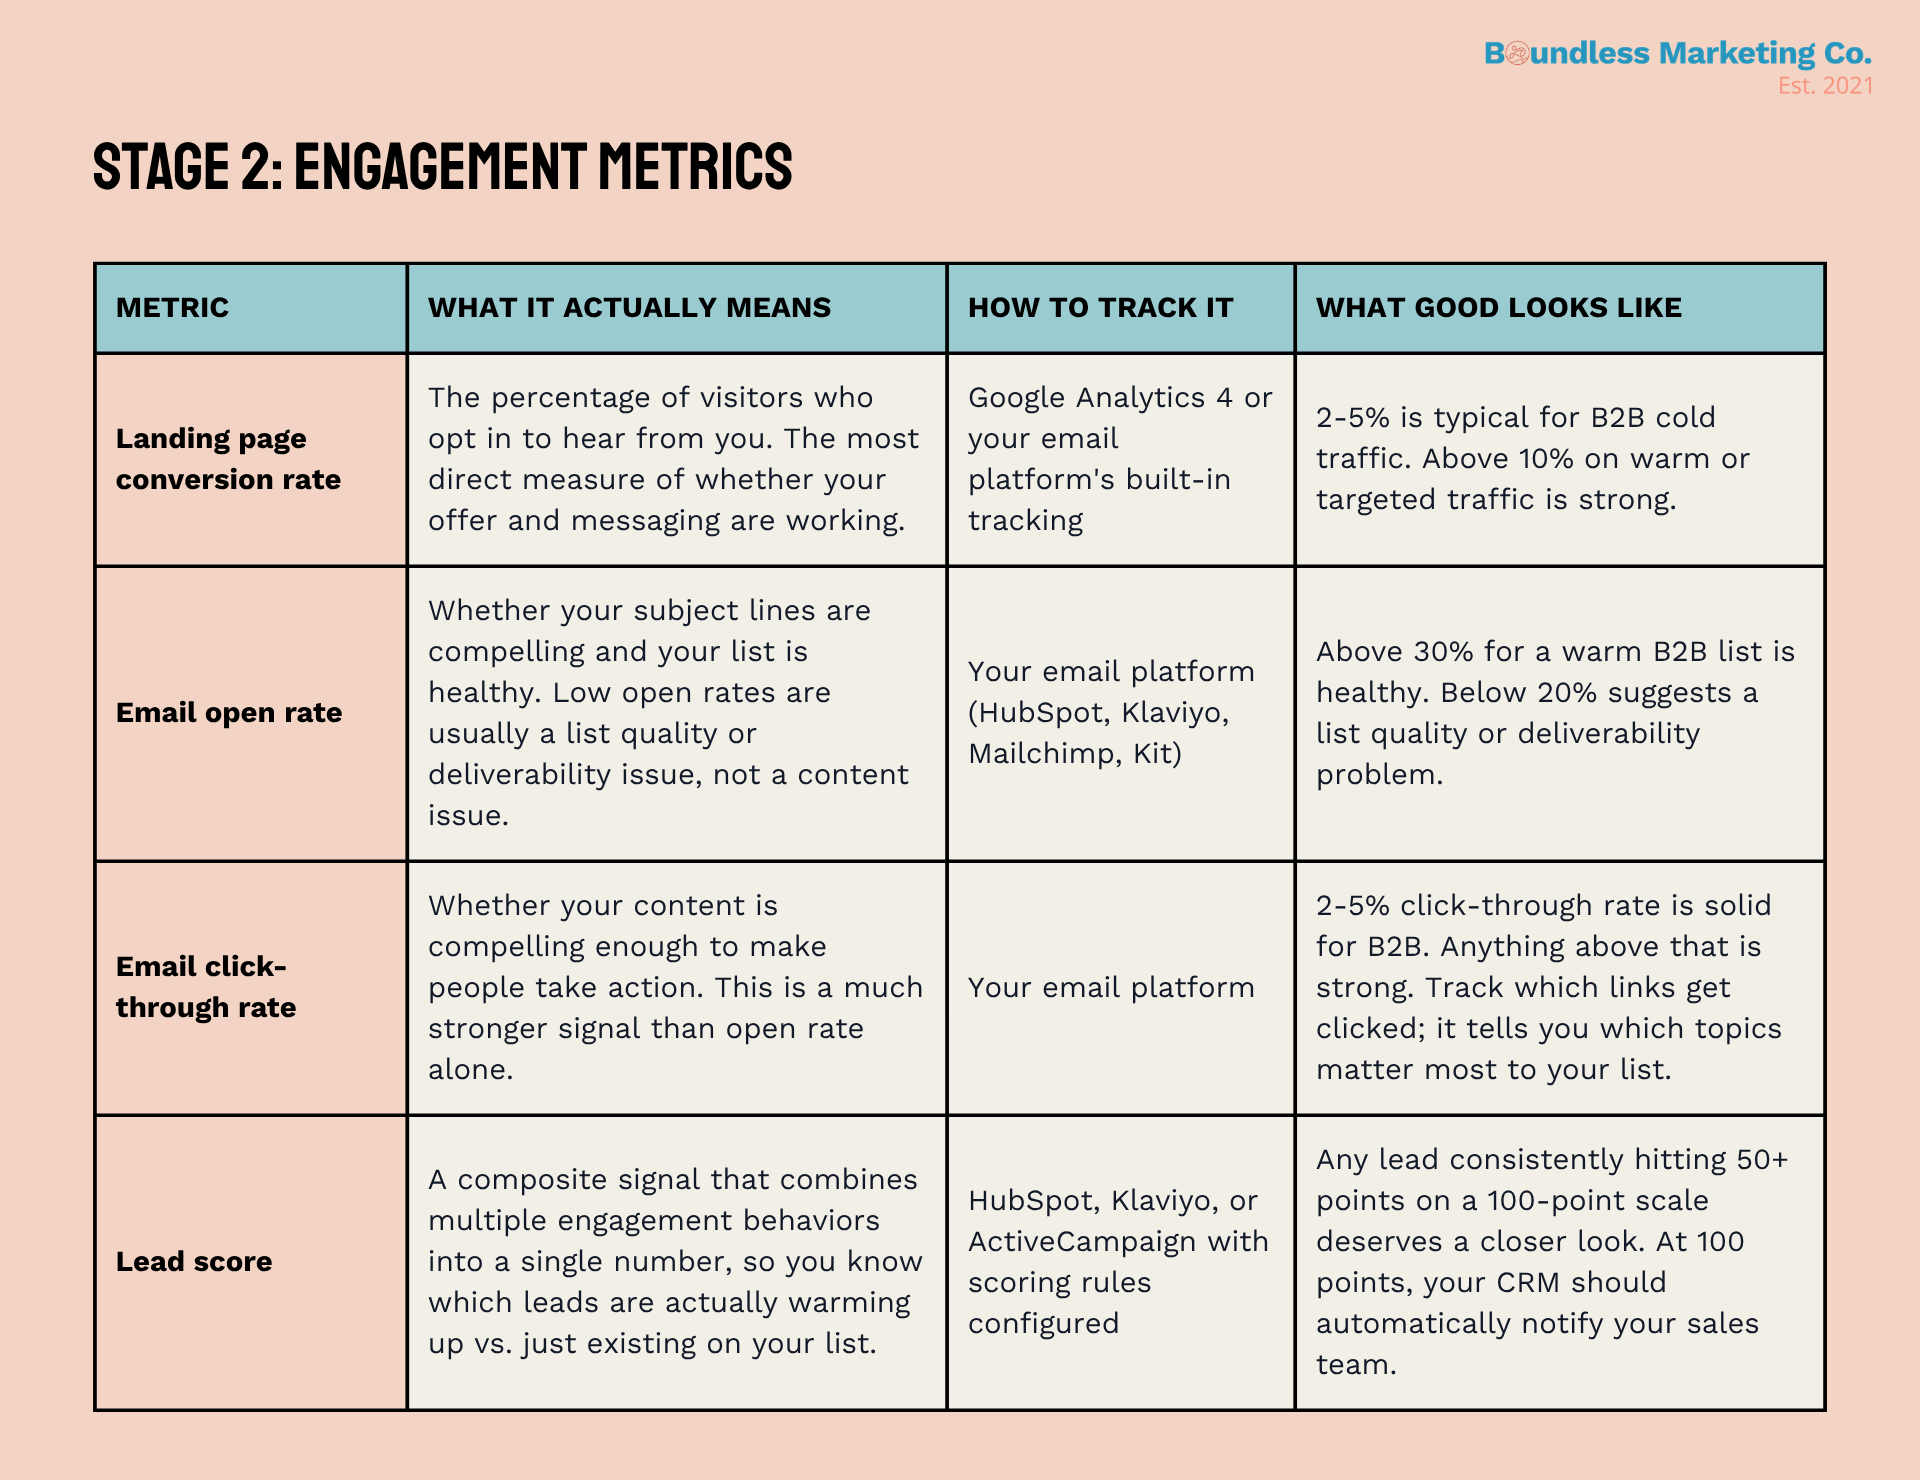
The Real Meaning of Email Open Rate
Email open rates have become harder to interpret since Apple's Mail Privacy Protection feature started preloading email content in 2021, inflating open rates for users on Apple devices. That doesn't mean open rate is useless, but it does mean you should treat it as a directional indicator rather than a precise measurement.
What open rate is genuinely useful for is tracking trends over time within your own list, comparing subject line approaches in A/B tests, and identifying deliverability problems. If your open rate drops suddenly and significantly, it usually means your emails are landing in spam, not that your content got worse overnight.
A warm, engaged B2B list should be seeing open rates above 30%. If you're consistently below 20%, the problem is likely one of three things: your list has too many cold or inactive contacts, your subject lines aren't compelling, or you have a deliverability issue worth investigating.
Click-Through Rate: The Stronger Signal
If open rate tells you whether your subject line worked, click-through rate tells you whether your content worked. Someone who opens an email and then clicks a link inside it is telling you something concrete: this topic was interesting enough to act on.
This is why click-through rate is a much more reliable signal of content quality and audience fit than open rate. You can inflate open rates with a clickbait subject line. You can't inflate click-through rates without delivering something genuinely worth clicking.
Track not just the overall click-through rate of each email, but which specific links get clicked most often. If the link to a case study about a specific industry consistently outperforms every other link in your newsletter, that's a signal about what your audience cares about. Let it shape your content calendar.
Lead Scoring: Turning Behaviors Into a Number
Lead scoring is the practice of assigning point values to specific behaviors, such as visiting your pricing page, downloading a case study, or watching a product video, so you can track which leads are genuinely warming up and which are just sitting on your list.
The practical benefit is that it filters the signal from the noise. Instead of asking your sales team to manually review every lead to determine whether it's ready for outreach, a well-configured lead score handles that filtering automatically. When a lead's score crosses your threshold, usually around 100 points, your CRM sends an automatic notification to your sales team.
A simple lead scoring model for a B2B company might look something like this:
Visits the pricing page: +25 points
Downloads a case study: +20 points
Watches more than 50% of a demo video: +15 points
Clicks a link in an email: +10 points
Opens an email: +2 points
Visits the careers page: -30 points (probably a job seeker, not a buyer)
No engagement in 14 days: -10 points (lead is going cold)
Unsubscribes: reset to zero
The specific point values matter less than the principle: not all engagement is equal, and your system should reflect that. Someone who visits your pricing page is telling you something much more meaningful than someone who opened one email three weeks ago.
The Negative Scoring Principle
Most founders who implement lead scoring focus entirely on additive behaviors: what positive signals increase a lead's score. The negative scoring piece is just as important and almost always overlooked.
If a lead hasn't opened an email in 60 days, their score should be decaying. If they visit your careers page, their score should drop significantly. If they unsubscribe, they should be removed entirely from the active sales view. Without these subtractions, your hot leads list gradually fills up with cold contacts who haven't engaged in months, and it stops being a useful tool.
What to Build First
If you're just getting started with awareness and engagement tracking, here's the order we recommend for setting things up.
Connect Google Search Console to your website (free, 15 minutes). Start tracking branded vs. non-branded search split immediately.
Set up a basic social media analytics review. You don't need a paid tool to start. Native platform analytics give you follower growth and engagement rate for free.
Configure your email platform to track open rates and click-through rates per email. If it's not already doing this, switch to a platform that does.
Set up a basic lead scoring model in your CRM. Start with five to six rules, implement negative decay, and set a 100-point threshold for sales notification.
Review all four categories of metrics at the end of every week and track them in a simple spreadsheet. Trends matter more than snapshots.
Vanity metrics feel good, but they don’t help you make decisions. The transition from tracking one to tracking the other is one of the clearest signs that a marketing operation is maturing.
You don't need a sophisticated analytics stack to do this well! You just need Google Search Console, your email platform's built-in reporting, your social analytics, and a CRM with basic lead scoring. That's it. The insight comes from looking at those numbers consistently, with the right questions in mind.
Up Next: Part 9 goes deeper on lead scoring specifically -- how to build a model from scratch, how to set the right sales-ready threshold, and how to make sure your hot leads list actually stays hot.
About This Series: This post is part of The Startup Marketing Playbook, a 12-part newsletter and blog series for tech and SaaS founders. Each installment covers one core concept in depth, with actionable frameworks you can apply immediately.